Did you know that you can find out how many unique users engaged with your content more than once in the last week using just Facebook Insights and Microsoft Excel? Read on to learn how to do it.
Brands on Facebook are increasingly obsessed with engagement metrics. Most marketers measure engagement using “invisible” clicks, likes, comments, and shares. These metrics are important in indicating the quality of your content, but you can obtain more representative metrics if you did a bit of dirty work on your own. Doing so will help you answer questions like “how many unique users consistently engage with your content?” and “how many unique users only engage with your content once?”
Fortunately, Facebook Insights offers a LOT of data. I was able to calculate the number of unique users who engaged with my client’s page content more than once in any given period of 7 days. This offered us incredible insights into how our content was doing - were users engaging with our content more often? If that’s so, then our content marketing is building stronger emotional affinity between our fans and brand.
I’d like to add a word of caution that this engagement metric is not a replacement for conversion funnel metrics. In other words, while you might see an increase in leads generated in correlation to an increase in how often users engage with your page’s content, they do not have a clear cause-and-effect relationship. I am confident however that this correlation is positively strong. If you have a lead generation metric, I urge you to ascertain this fact by conducting a regression using the calculation I’m going to share with you below with your lead generation data.
How many unique users engaged with your content more than once a week?
To help you calculate this metric, I’ve listed the necessary steps below. First, export your data using Facebook Insights. The export data button is located at the top right hand corner of Facebook Insights.
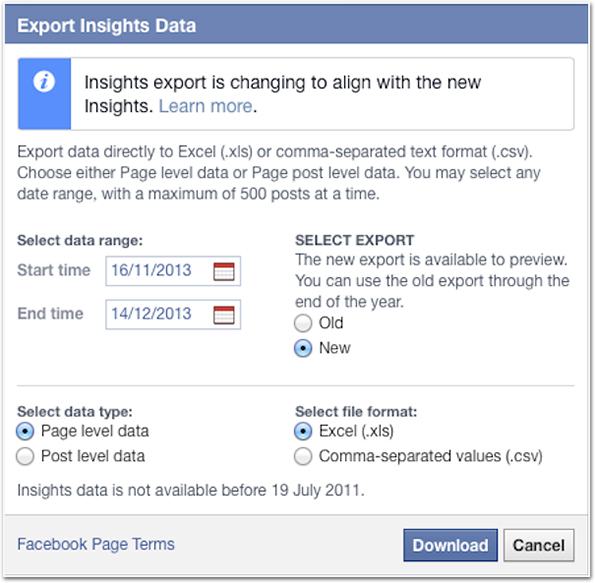
A pop-up box like the one below should appear.

- Choose the dates you want analysed and make sure you select the new export.
- The new Facebook Insights export includes both page and post level data, which offers a wide array of information you can use to your brand’s benefit. For now, we’ll only need the page level data.
- Also select the .xls file, which I found to include headings that explain the use of the data understood by the layman, a component I found missing in the .csv version.
- When you’re done, click “Download”.
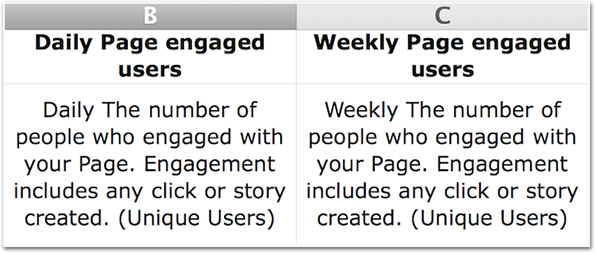
Open the downloaded Facebook export file and search for the columns shown below. Copy the 2 columns of data into a new Excel file. To easily select the data, select the heading of the column and press “CMD + Shift + Arrow Down” if you’re using Mac and “CTRL + Shift + Arrow down” if you’re using Windows. I’d advise you to also copy the “Date” column into the new Excel spreadsheet for easy reference.

How can we use the data above?
The columns above track how many unique users engaged with your content in 2 different time periods. Engagement is calculated by using the total number of clicks, likes, comments, and shares. By default, all likes, comments, and shares create user stories on Facebook, which are often seen in a small box of updates from friends located in the top right corner of your Facebook, and these are counted as engagement on top of clicks made by the users.
Now, add the above columns to your Excel spreadsheet.
- The data in column D simply sums up the number of unique users who’ve engaged with your content daily for a period of 7 days. In other words, it’s a sum of the last 7 rows of data found in column B, starting from the same row in column D (See the picture above). It is important for you to be aware that the user count in column D double counts users who engaged with your content more than once in the last 7 days. This is because the number of unique engaged users in column B is counted on a daily basis, thus the same user can be counted for consecutive number of days. This might be confusing initially, but I’ll elaborate more later to help you understand.
We’re getting there, stay with me.
- Column E is obtained by subtracting the data in column C from the data in column D. As mentioned above, column D includes double counted users who engaged with your content more than once in the past 7 days. Conversely, column C only counts unique users who engaged with your content in the past 7 days, excluding those who engaged with your content more than once in the same period. Thus it is safe to say that the difference between these 2 columns show the number of users who engaged with your content more than once in the past 7 days. And that’s exactly what column E is all about.
- Now this is the easy part, which is also the final part of our tutorial. To calculate the re-engagement rate in column F, divide the data in column E by the “weekly total reach” (See below).
- Ignore the formula E9/C9 shown in the above picture. C9 should be the “weekly total reach”, which is found in column I of your Page-level data.
Questions & Answers
- Why does the figure in column C change from day to day?
- That’s because column C calculates the number of unique users who engaged with your content in the past 7 days. Naturally, the figure changes because the number of unique users who engaged with your content in the last Sunday and today (Sunday) are not the same.
- Why are the first 6 rows in columns D - F empty?
- They should be, since we need to sum the data for the past 7 days in order to make the calculation for column D. If you’ve data before the stipulated date, you can export them and include them in the calculation, but that’s not critical here.
- Why did you use the Median function instead of the Average function?
- The reason why the Average function cannot be used lies in the unavoidable double-counting of unique users when using the Average function. The Average function sums up all the data in column F, divided by the number of days of data. However, doing so double-counts the same unique users who were included in consecutive rows of data. For example, the data in row 7 and row 8 counts the same users who have engaged with your content from Day 2 to Day 7 (Overlap days), which will add double weight to your Average function. The only difference in the data from row to row in column F is the old Day 1 and new Day 7 data. Hence, the Median function represents your average re-engagement rate more accurately.
Questions? Let us know in the comments below!


Pingback: Tutorial: How many users clicked on your links more than once in the last week?