Lots of people create Facebook Ads without knowing how to sustain their efforts.
Most of the time, they failed to plan ahead.
As I scoured for content online, I found that most questions about Facebook Ads can be categorised into 3 groups:
- Which metrics should you pick to evaluate your advertising efforts?
- How do you interpret your advertising metrics?
- What do you do next?
I will try to tackle the last question today.
There’s one important tool
There’s one important tool that you must know and use.

It is the Facebook Ad Report.
Facebook Ad Report is a customisable report of your Ad campaign(s). With it, you can see your most important Ad metrics and learn how you’re reaching your business goals.
Why you should use the Facebook Ad Report
There are tons of reasons why you should use the Facebook Ad Report.
The most compelling ones I have in mind include:
- Saving you time and trouble on certain A/B tests
- Giving you an idea which half of your advertising is not working
How does Facebook Ad Report reduce the time you spend on optimising Ad campaigns?
A lot of you might be unaware that Facebook’s revamp of the Ad campaign structure has simplified the process of A/B testing.
How do you know if you’re one of them? Well…
If you’re still creating separate Ads to test the effectiveness of placing your Ads in the desktop newsfeed VS mobile newsfeed VS desktop sidebar, you’re one of them.
If you’re still creating separate Ads to test the effectiveness of targeting users from different countries, you’re one of them.
If you’re still creating separate Ads to test the effectiveness of targeting users with different gender or from different age groups, you’re one of them.
And if you’re one of them, read till the end of this post.
How does Facebook Ad Report tell you which Ads are not working?
Allow me to start with a cliche.
Jon Wanamaker, widely considered as a marketing and advertising pioneer, once professed, “Half the money I spend on advertising is wasted, the trouble is I don’t know which half.”
But Facebook has changed that.
With the Facebook Ad Report, you can find out to a large extent, which half of your advertising isn’t working. Because of that, you can divert your dollars to the ones that are working and continue milking more out of them.
Where to find it
Before I show you how you can use the Facebook Ad Report to accomplish what I mentioned above, let me guide you to find the Ad report page so that you can follow me closely. If you already know how to get access to your Ad reports, go ahead and skip to the next section

From anywhere in Facebook, click on Ads Manager on the left sidebar.

Then, click on Reports on the left sidebar and you’re done.
Start simple
Let’s start simple and not get ahead of ourselves. Once you get the hold of it, you can explore the other possibilities.

First, click on Edit Columns and you should see the popup below.
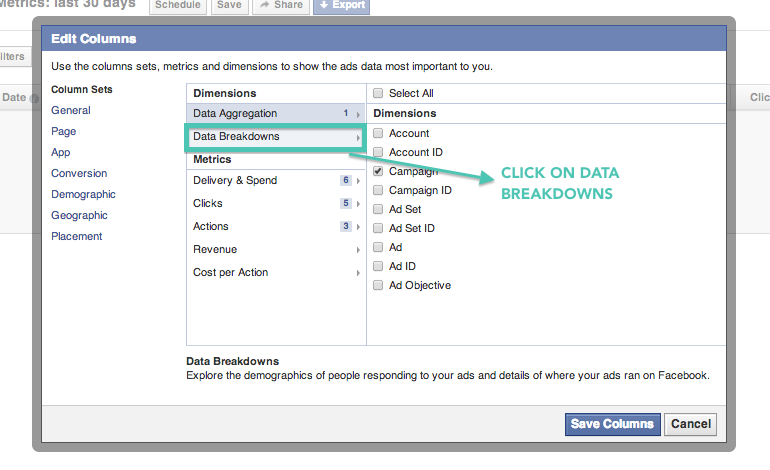
Then, click on Data Breakdowns.
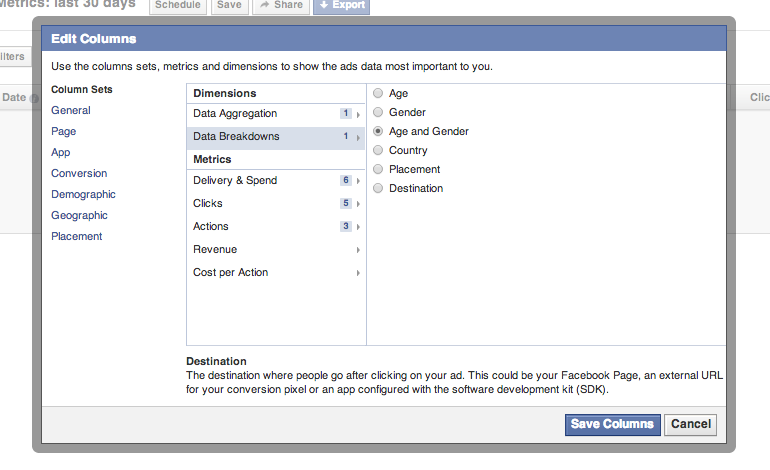
You can choose to look at your Ad campaign performance by age and gender, country, placement, or destination. But let’s start with Age and Gender first.
Before you click Save Columns, let’s assume that your Ad objective in this case is to increase your Page Likes. Then, these metrics should be the most relevant to you:
- Delivery & Spend > Reach, Frequency, Cost per 1,000 people reached, Spend
- Actions > Page likes
- Cost per Action > Cost per page like
After you have selected the options above, click Save Columns.
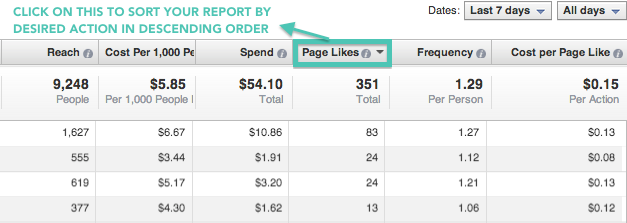
You should see something that resembles the image above.
Click on the header of the column Page Likes before you do anything. This will help you sort all the Ads by the number of desired actions they have achieved.
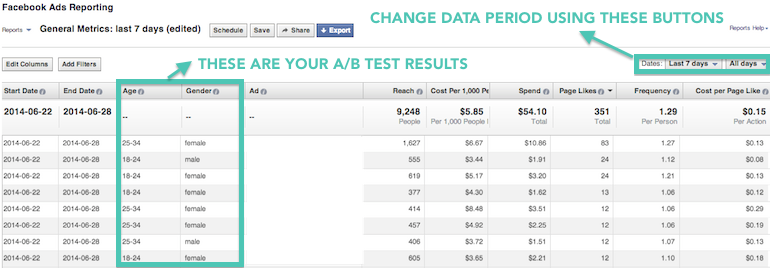
You can choose to look at the results over a longer time period using the buttons on the top right.
The one thing that most ad managers miss
Remember when we selected the option Age and Gender?
Well, the Ad report generated breaks down all the Ads that you ran by different age groups and gender (including other genders not shown above), on the right side, you can look at their performance easily.
Reach shows you how many unique users were served your Ad.
This is important because you will want to make changes to your Ads only when the results are statistically significant.
There are several sample size formulas you can find online to determine the mark you need to cross to get a statistically significant result. But as a rule of thumb, any sample size larger than 1,500 is representative of populations of any size.
Cost per 1,000 persons reached is a less important metric here, so let’s keep it in view. It shows you how much each Ad costs you to reach 1,000 different people.
Spend is also self-explanatory, and is a key metric you will report to your management team or client to show them how much of their budget was allocated to the more effective Ads. It makes you look smart, trust me.
Let’s skip Page likes and get to Frequency first. Frequency means the number of times your Ad was served to the same person on average.
Note that the key word here is average. We know that the average person doesn’t exist, but since individual frequency metric is still not available (although Facebook is reportedly working with individual ad buying agencies on allowing them to set maximum frequency), this gives us a gauge of how many times most of the users are served your Ads.
Another rule of thumb is that it takes someone to see something at least three times before remembering it. This means that you’re better off if your Ad frequency goes above three, especially if you want to drive awareness.
Let’s get to the exciting part - Page likes (or whichever your desired action is)
Look at the Ads that drive 80% of your desired actions. Based on the 80-20 rule, these should include about 20% of the Ads that you’re running.
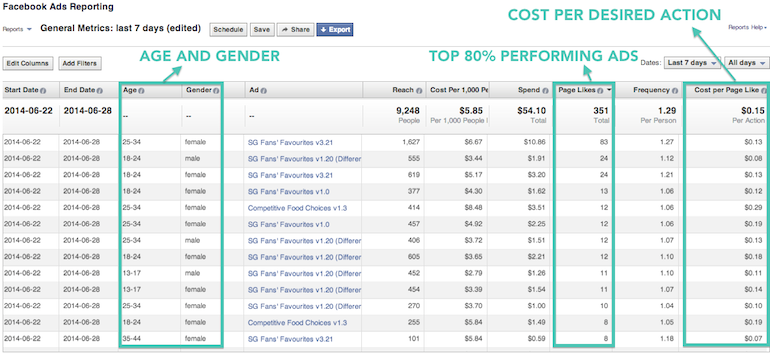
With each Data Breakdown option (or A/B test variables), there are some meaning interpretations and uses.
For Age and Gender, you can see if the Ad is causing a change in your original target audience.
In the case of a Page Like ad, Age and Gender data can show you whether the demographic composition of your Fan Base is changing. To do so, you can compare these results to your page demographics (see image below).
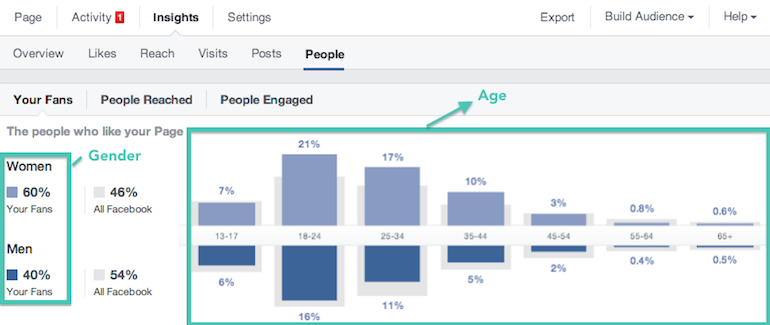
If your Page demographic structure is indeed changing, then you need to decide whether your Ad campaign is attracting the right group of people.
In my client’s case, we decided to limit our Ad campaigns to age 13-35 because we did not want to attract the larger age groups. Reasons abound, but one of the key reasons was that our customers were mainly age 13-35 and we were not looking into targeting the older age groups.
For the other Data Breakdown options, namely Country, Placement, and Destination, you can do something similar:
- Country: Is the geographic structure of your Fan Base changing? Is this what your business wants? For example, are you expanding or targeting people from another country? The method of analysis is very similar to what I’ve described above for Age and Gender so that’s something you can refer to
- Placement: Are more people committing your desired action through mobile or desktop? Does that affect the way these users eventually use your product? For example, if you’re selling a desktop-only web app, will increasing the number of sign-ups via mobile mean more inactive users for your app? Or will increasing the number of page likes via mobile mean more disengaged fans on your Facebook page?
- Destination: Are more people entering your website through a certain page? Is this something you want to encourage or change?
I feel there’s a lot of value in what I just wrote in bullet points above, so I want you to take some time to read and digest them.
Your turn
I meant to keep this post short but it seems like I’ve shot over 1,400 words. But allow me to nag once more.
You should do these once you’ve started running ad campaigns for at least a week.
Please do not jump into optimising your Ads. In other words, before you consider the optimising your Ads through cutting those Ads that are delivering less Desired Actions for you, you need to first consider the qualitative side of your A/B tests.
If changing the demographic, geographic, or behavioural attributes of your fans is not what you want, then you should make the necessary adjustments (like what I did to limit the target age group for my client) before you optimise the Ads to maximise the number of Desired Actions.
This way, I guarantee that you will see better conversion numbers at the end of the funnel because you would be driving a highly targeted and relevant group of target audience to commit your Desired Action.
Want to see how you can optimise your Ads to achieve better results? I wrote a follow-up article here.
If you liked this article and want to learn more on how to eliminate content and ads that suck, sign up for my newsletter here.


Pingback: Facebook marketing weekly review (July 4th 2014)